格物
趋中回归1886
regression toward the mean
statistical phenomenon
In statistics, regression toward the mean is the phenomenon where if one sample of a random variable is extreme, the next sampling of the same random variable is likely to be closer to its mean. Furthermore, when many random variables are sampled and the most extreme results are intentionally picked out, it refers to the fact that a second sampling of these picked-out variables will result in "less extreme" results, closer to the initial mean of all of the variables.
摘自英文维基百科「Regression toward the mean」(英文维基百科,暂无中文条目),CC BY-SA 4.0
- 类型
- 现象
- 发现 / 发明时间
- 1886 年
- 发现者 / 提出者
- 弗朗西斯·高尔顿
- 学科
- 生物学
- 上级概念
- 现象
- 带来的结果
- 回归谬误
相关科学家

百科正文
本条目暂无中文维基百科条目,下面是英文维基百科原文。
Mathematically, the strength of this "regression" effect is dependent on whether or not all of the random variables are drawn from the same distribution, or if there are genuine differences in the underlying distributions for each random variable. In the first case, the "regression" effect is statistically likely to occur, but in the second case, it may occur less strongly or not at all.
Regression toward the mean is thus a useful concept to consider when designing any scientific experiment, data analysis, or test, which intentionally selects the most extreme events - it indicates that follow-up checks may be useful in order to avoid jumping to false conclusions about these events; they may be genuine extreme events, a completely meaningless selection due to statistical noise, or a mix of the two cases.
Conceptual examples
Simple example: students taking a test
Consider a class of students taking a 100-item true/false test on a subject. Suppose that all students choose randomly on all questions. Then, each student's score would be a realization of one of a set of independent and identically distributed random variables, with an expected mean of 50. Naturally, some students will score substantially above 50 and some substantially below 50 just by chance. If one selects only the top scoring 10% of the students and gives them a second test on which they again choose randomly on all items, the mean score would again be expected to be close to 50. Thus the mean of these students would "regress" all the way back to the mean of all students who took the original test. No matter what a student scores on the original test, the best prediction of their score on the second test is 50.
If choosing answers to the test questions was not random – i.e.
History
Discovery
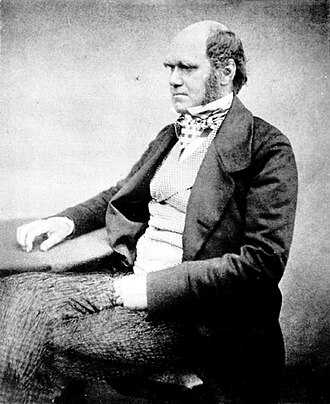
The concept of regression comes from genetics and was popularized by Sir Francis Galton during the late 19th century with the publication of Regression towards mediocrity in hereditary stature. Galton observed that extreme characteristics (e.g., height) in parents are not passed on completely to their offspring. Rather, the characteristics in the offspring regress toward a mediocre point (a point which has since been identified as the mean). By measuring the heights of hundreds of people, he was able to quantify regression to the mean, and estimate the size of the effect. Galton wrote that, "the average regression of the offspring is a constant fraction of their respective mid-parental deviations". This means that the difference between a child and its parents for some characteristic is proportional to its parents' deviation from typical people in the population.
Importance
Regression toward the mean is a significant consideration in the design of experiments.
Take a hypothetical example of 1,000 individuals of a similar age who were examined and scored on the risk of experiencing a heart attack. Statistics could be used to measure the success of an intervention on the 50 who were rated at the greatest risk, as measured by a test with a degree of uncertainty. The intervention could be a change in diet, exercise, or a drug treatment. Even if the interventions are worthless, the test group would be expected to show an improvement on their next physical exam, because of regression toward the mean. The best way to combat this effect is to divide the group randomly into a treatment group that receives the treatment, and a group that does not. The treatment would then be judged effective only if the treatment group improves more than the untreated group.
Alternatively, a group of disadvantaged children could be tested to identify the ones with most college potential.
Definition for simple linear regression of data points
This is the definition of regression toward the mean that closely follows Sir Francis Galton's original usage.
Suppose there are n data points {yi, xi}, for i = 1, 2,..., n. We want to find the equation of the regression line, i.e. the straight line y=α +β x,
which would provide a best fit for the data points. (A straight line may not be the appropriate regression curve for the given data points.) Here the best will be understood as in the least-squares approach: such a line that minimizes the sum of squared residuals of the linear regression model. In other words, numbers α and β solve the following minimization problem:
Find min _(α, β)Q(α,β), where (公式略)
Using calculus it can be shown that the values of α and β that minimize the objective function Q are (公式略)
where rxy is the sample correlation coefficient between x and y, sx is the standard deviation of x, and sy is correspondingly the standard deviation of y. Horizontal bar over a variable means the sample average of that variable.
Definitions for bivariate distribution with identical marginal distributions
Restrictive definition
Let X1, X2 be random variables with identical marginal distributions with mean μ. In this formalization, the bivariate distribution of X1 and X2 is said to exhibit regression toward the mean if, for every number c > μ, we have μ ≤ E [X₂| X₁=c]<c,
with the reverse inequalities holding for c < μ.
The following is an informal description of the above definition. Consider a population of widgets. Each widget has two numbers, X1 and X2 – say, its left span (X1) and right span (X2). Suppose that the probability distributions of X1 and X2 in the population are identical, and that the means of X1 and X2 are both μ. We now take a random widget from the population, and denote its X1 value by c (c may be greater than, equal to, or smaller than μ). We have no access to the value of this widget's X2 yet. Let d denote the expected value of X2 of this particular widget; i.e., let d denote the average value of X2 of all widgets in the population with X1 = c. If the following condition is true:
Alternative definition in financial usage
Jeremy Siegel uses the term "return to the mean" to describe a financial time series in which "returns can be very unstable in the short run but very stable in the long run." More quantitatively, it is one in which the standard deviation of average annual returns declines faster than the inverse of the holding period, implying that the process is not a random walk, but that periods of lower returns are systematically followed by compensating periods of higher returns, as is the case in many seasonal businesses, for example.
以上节选摘自英文维基百科「Regression toward the mean」,按 CC BY-SA 4.0 使用,去掉了参考文献、外部链接等尾部小节,公式改写成了纯文本。篇幅所限,较长的小节只摘了开头一部分,有的小节没有收;全文、配图和出处见原文。